In General
At the end of your programming phase often you’d like to measure the speed of your program – at least I do, since often my goal is to keep everything within 50Hz.
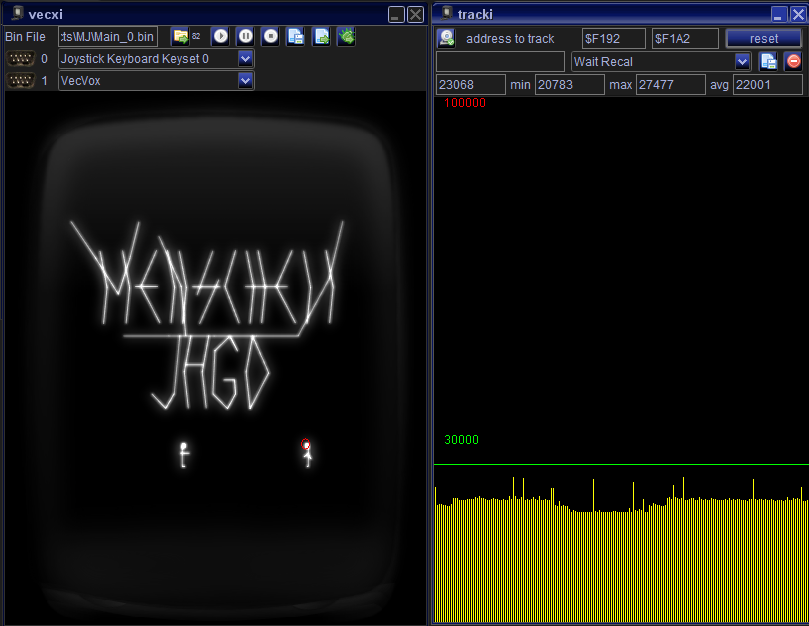
In Vide my tool of choice usually is just watching what “tracki” has to say. (see above)
Tracki tells you how many cycles have passed between the execution of two code addresses. If you do “simple” programs most of the time you will use the default settings and let tracki measure the time between exit and entry of the “WaitRecal” function. That way you get a pretty accurate measurement of how fast your program in general executes.
Tracki displays the last measured round, the minimum cycles, the maximum cycles and the average. The reset button starts a new measurement, and resets all permanent (min/max) records.
I usually watch only the maximum and am content if it is below 30000 cycles (which is 50Hz display rate).
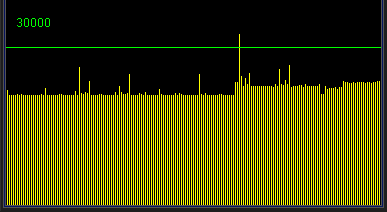
If the maximum gets above 30000 I get “nervous” – but that does not mean you have to change your code yet, look at the image to the right. There is one single peek of about 34000 cycles.
Nobody knows what happened there – perhaps a new piece of music started, random luck was really mean or cosmic rays hit the vectrex – what ever happened – you do not need to be concerened. No user will notice single peaks. Time spent to seek this one out and optimize the code so it never ever occurs is NOT WORTH it!
Tracki – some more info
As said above tracki measures between to memory locations.
a) make sure the little check on the “camera” is on – otherwise tracki will not track
b) default is tracking of WaitRecal, but you can change the default in case you want to track one function only, or you have a “custom” WaitRecal routine (I usually do)
c) in the first two fields you can enter the tracking address. The “lower” memory address goes first – the higher memory address later. The measurement usually is done in the exactly opposite order. Since the default is WaitRecal I measure between the EXIT of WaitRecal and the ENTRY of WaitRecal – that is the time your own programs usually take. Just remember that the measurement is in the opposite order than the order of the address fields.
d) you can save your own measurement address using the little “disk” button (also you can delete ’em)
Measuring different programs/versions
Lets say you have two different versions of one and the same programm and want to compare them. There are two ways to do that:
- sequentially (running)
- parallel (running)
Sequentially is quite easy, just start a program run it measure it – when done, do the next.
Parallel is not so easy any more in Vide (it used to – but I changed Vide) – nevertheless – the easiest way to do parallel measurement is to start two Vide instances – and load the different binaries in both of them.
Anyway – the measurements taken can be done in quite a few different ways:
a) by the eye and hitting pause 🙂

Example:
Let us say I had two different version of “The count” one with a suffix “inline” and one with the suffix “function” (resemblence to any real world occurences is pure coincidence!).
Inline
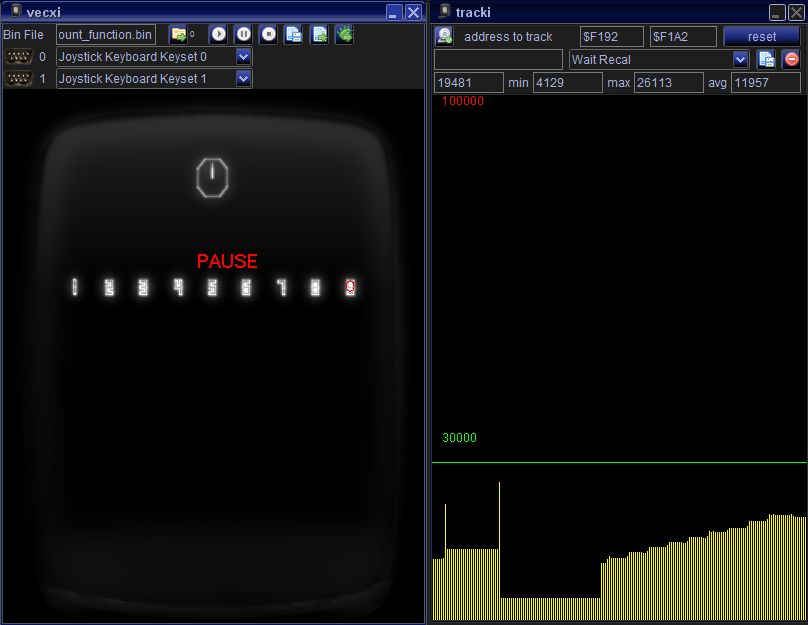
Here I waited till something was done on the screen and hit pause at a “stable” moment. The numbers all appeared, but the bow did not appear yet. One has about 1/2 second time to hit pause (which is quite long) – and you thus have a fairly “stable” place to take a snapshot. If you look now at the current cycle count it reads “20450” (the counter furthest to the right).
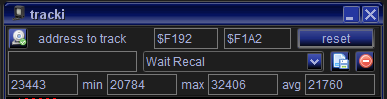
Function
On the left you see the second example. I also pressed “pause” at the “same” stable moment and look at tracki – here it reads “19481” – about 1000 cycles faster than the other version.
One might repeat the process in order to find out if the places that were used to pause are indeed stable and give the same measurements a second time (which they do).
Anyway – this still migth be a rather “clumsy” measurement method.
There are more and different ways you can do measurement in Vide. I will in the following “scratch” the surface a little bit more.
Profiler
The “term” profiling I use quite generously when Vide is concerned – I beg the forgiveness of any REAL profiling.
Just so you know – this is yet another version of the count (in case you are wondering about the numbers) – this one takes 28407 cycles at the above measurement point.
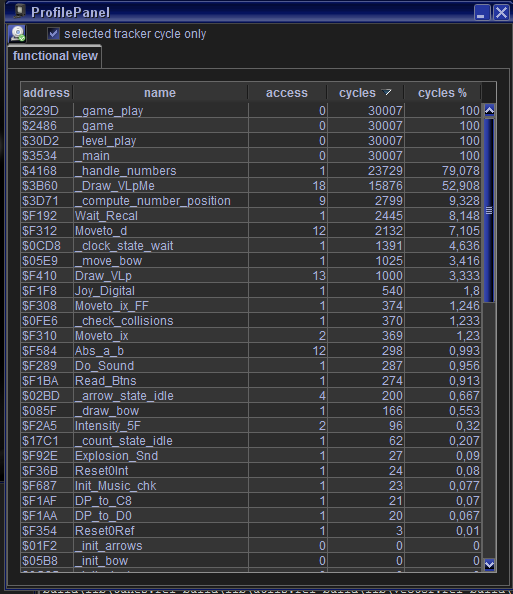
What you see at the left is a part of the profiling data that was collected in the last round.
(Interlude:
The Profiler has two “modes” – in this example I refer to the mode where the profiler uses tracki to define one “game round”)
The table can be sorted by every column, I sorted it by cycle usage. Functions sum up all cycles that were taken from entry to exit. You see that the first 4 functions all run for 30000 cycles (+7), this is what the stack investigation has to say about the program – there are several calls untill the “main loop” is actually reached – every function above receives the sum of its callees…
The cycles column can not be added up – each row may contain sums of of other rows.
That also means, you as a reader of the profiling must have some knowledge of the program you want to look at.
(and it very much helps if you compiled the program using Vide – since than meta information such as function names – are available!)
Anyway – here you can see – that the function “handle_numbers” was called once – and all in all it took 23739 cycles to finish. If you look at the image of the count again – you will notice – that well – pretty much all that was printed – were the numbers (and one clock). “compute_number_position” was called nine times – well there are 9 numbers – this seems reasonable.
“Draw_VLpMe” was called 18 times – which suspiciously is double the number count of 9. Either there is something wrong – or each number might be printed in two stages (don’t know the code by heart just now).
“Draw_VLp” was called 13 times – my guess would be that the clock is drawn using that function – here helps the knowledge that that functions jumps to its beginning – this might actually be only one call which has a loop of 13 vectors.
“Wait_Recal” took 2445 cycles – this value is roughly the 30000 – “cycle measurement in tracki” – very roughly 😉 – but seems ok.
and so on.
Using the profiler you can drill down your findings and watch if some functions are called too often or not at all…
Dissi I
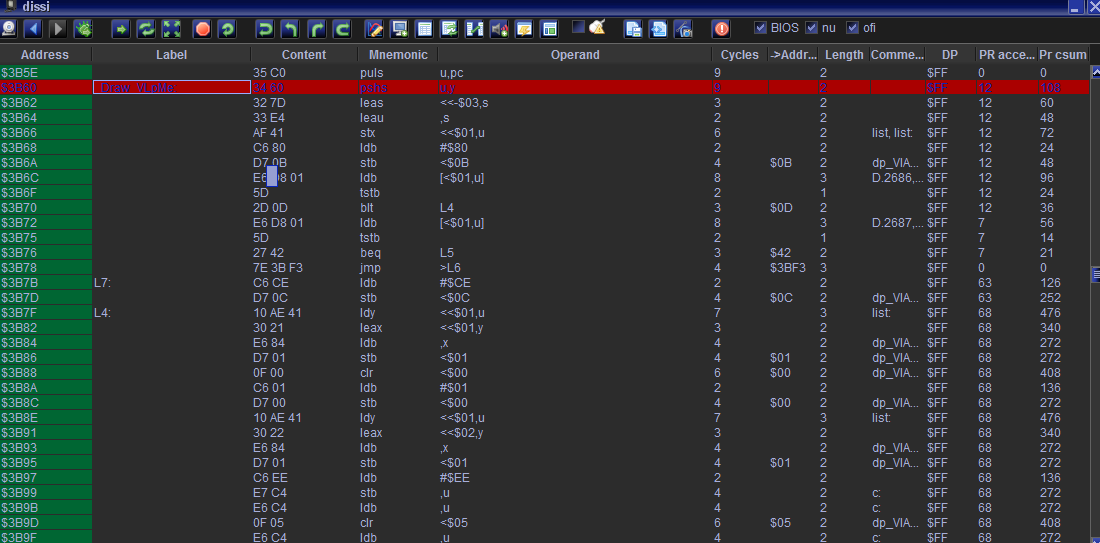
With profiling enabled you can also use dissi to watch address specific information:
Here I show in dissi the location of the “Draw_VLpMe” function (to locate the function – you can use the search field in dissi).
(Note: in dissi always the currently collected data is displayed – whereas in the profiler you always see the complete collected data of the last executed “round”).
In the last two colums of dissi (you can switch colums off/on in configuration) you see how many times each “address” was executed and the sum of cycles these executions took (in the current round). Using this you can examine functions and function parts for relevance and optimization.
Dissi II
If you want to examine a function, a code section or whatever – for the cycles they take, you can also do that manually.
Lets say I manually want to measure the above function “Draw_VLpMe“. What I’d do is search the function,
set a breakpoint:
take one step back:
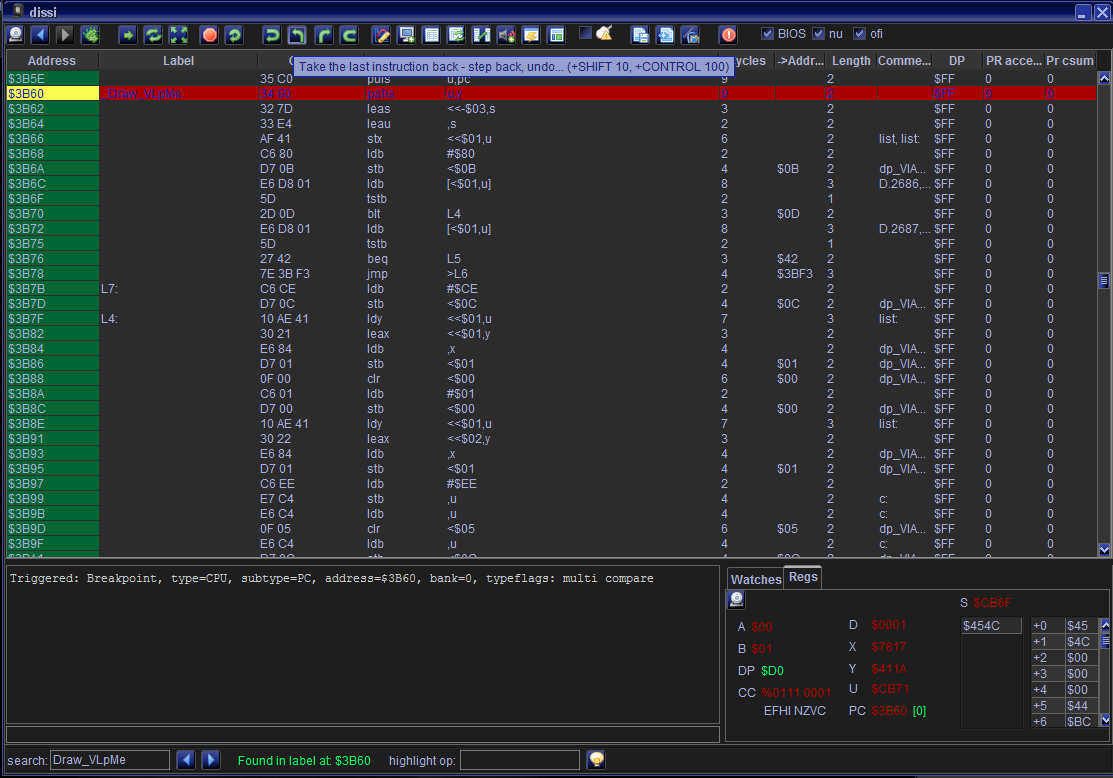
set the vide cycle counter to 0:
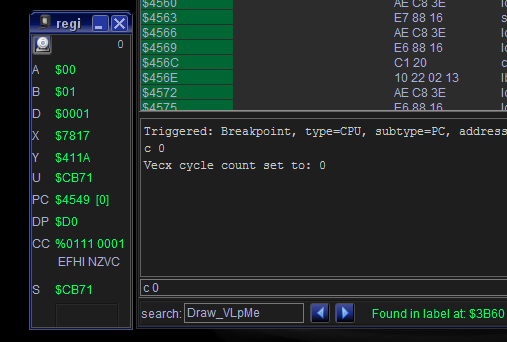
Overstep the subroutine:
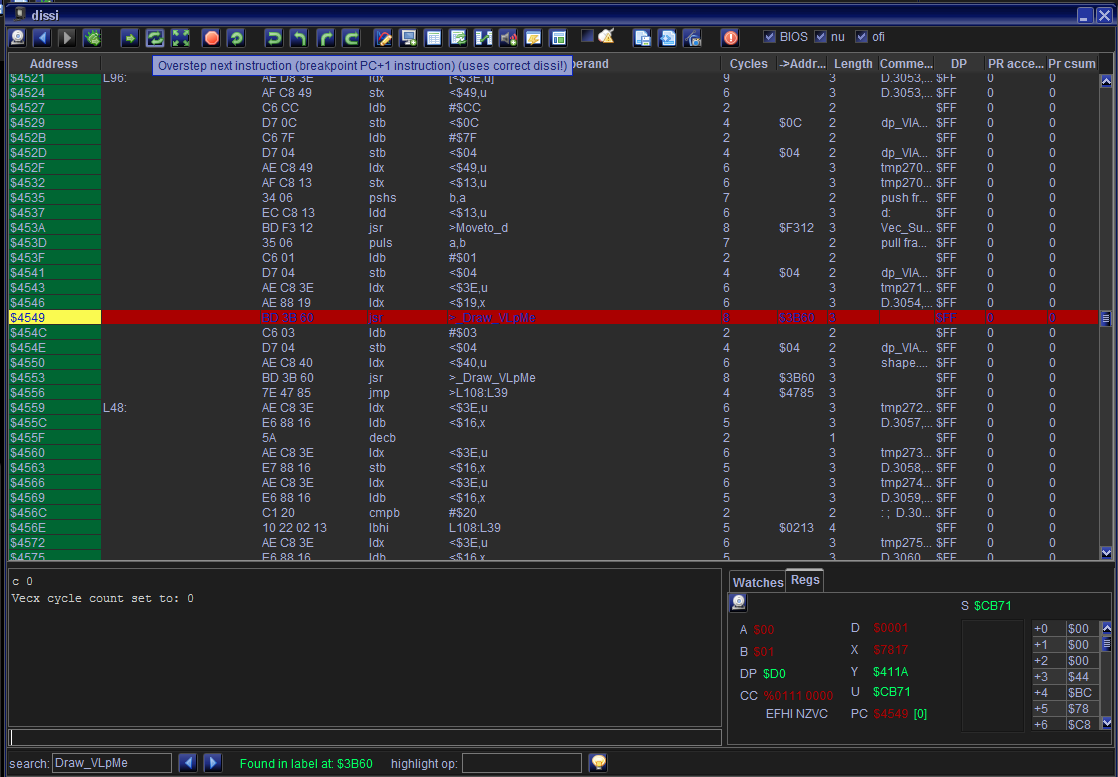
and output the current cycle counter (or look at regi):
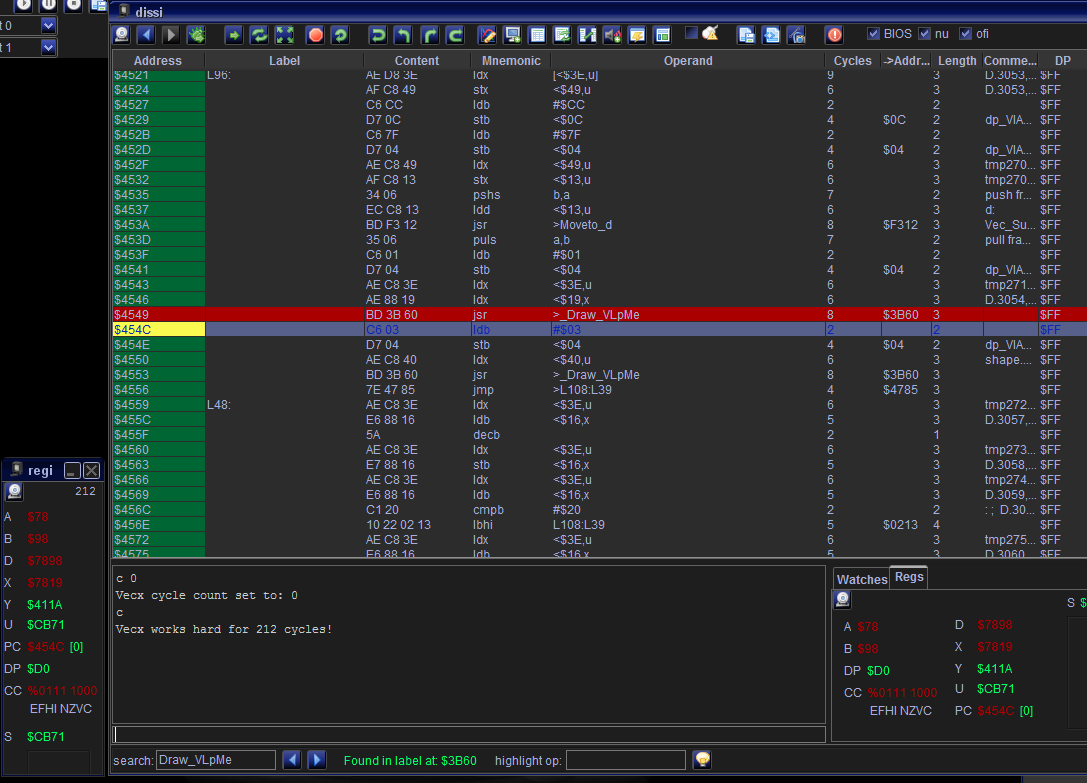
Now I know that the one subroutine took exactly 212 cycles.
(you can single step/multi step further, the cycle counter is always updated (even when you take steps backwards) )
Dissi III
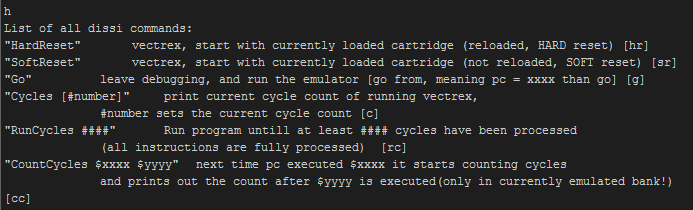
There are a few other cli – commands of dissi which might be helpfull:
That’s a short introduction to “cycle counting”!
Malban
PS
For everything above you must have switched “on” the debugging in Vide!
Many thanks! 🙂